Syria Nighttime Light Index: September 2025
September 2025 data reveals a countrywide year-over-year growth in median nighttime light levels
The September 2025 edition of Syria Nighttime Light Index reveals a countrywide year-over-year growth in median nighttime light levels.

Median Nighttime Light Levels per Governorate: September (2016 - 2025)
Key Highlights
Countrywide Growth: All 14 governorates saw a year-over-year increase in median nighttime light levels in September 2025.
Growth Variation: The increases ranged widely across governorates, from 9.1% in Latakia to 48.9% in Idlib.
Request Access
The complete dataset, which includes monthly data from April 2012 through September 2025, is available upon request. You can request access by filling out the inquiry form on our product page.
About This Product
Syria Nighttime Light Index is a satellite-derived data product by Syria From Above. It tracks monthly nighttime light trends across Syria at the governorate, district, and subdistrict levels—available from 2012 to the present.
Acknowledgment
Syria Nighttime Light Index uses open-access data provided by the National Oceanic and Atmospheric Administration (NOAA) and the OpenStreetMap (OSM) community. It is intended for informational purposes only.
Syria Burned Area Index: August 2025
August 2025 data reveals burn scars in three Syrian governorates
The August 2025 edition of Syria Burned Area Index reveals burn scars in three governorates, concentrated in the country's north-west.

Burned Area by Governorate (Hectares): August (2016–2025).
Key Highlights
The most affected governorate: Hama recorded the largest burned areas in the country with nearly 8,600 hectares.
Notable Burns Elsewhere: Significant burn scars were also detected in Latakia and Aleppo, totaling nearly 2,500 hectares combined.
Vast Majority Unaffected: Most of the country remained unaffected, with 11 out of 14 governorates recording no satellite-detected burn scars.
Request Access
The complete dataset, which includes monthly data from November 2000 through August 2025, is available upon request. You can request access by filling out the inquiry form on our product page.
About This Product
Syria Burned Area Index is a satellite-derived data product by Syria From Above. It tracks monthly burned areas across Syria at the governorate, district, and subdistrict levels—available from 2000 to the present.
Acknowledgment
Syria Burned Area Index uses open-access data provided by the National Aeronautics and Space Administration (NASA) and the OpenStreetMap (OSM) community. It is intended for informational purposes only.
Syria Burned Area Index: July 2025
July 2025 data reveals burn scars in four Syrian governorates
The July 2025 edition of Syria Burned Area Index reveals burn scars in four Syrian governorates, primarily concentrated along the coast.

Burned Area by Governorate (Hectares): July (2016–2025).
Key Highlights
Decade-High Burns in Latakia: Latakia recorded over 12000 hectares of burned land, the highest total for the governorate in July over the past decade.
Minimal Burns Elsewhere: Burn scars detected in other governorates were negligible in comparison. Rif Dimashq, Ar-Raqqah, and Al-Qunaitra had small, localized burn scars, totaling only 141 hectares combined.
Most of the Country Was Unaffected: A vast majority of Syria, 10 out of 14 governorates, recorded no satellite-detected burn scars.
Request Access
The complete dataset, which includes monthly data from November 2000 through July 2025, is available upon request. You can request access by filling out the inquiry form on our product page.
About This Product
Syria Burned Area Index is a satellite-derived data product by Syria From Above. It tracks monthly burned areas across Syria at the governorate, district, and subdistrict levels—available from 2000 to the present.
Acknowledgment
Syria Burned Area Index uses open-access data provided by the National Aeronautics and Space Administration (NASA) and the OpenStreetMap (OSM) community. It is intended for informational purposes only.
Syria Vegetation Index: August 2025
August 2025 data reveals a nationwide year-over-year decline in median NDVI levels
The August 2025 edition of Syria Vegetation Index reveals a nationwide year-over-year drop in median NDVI (Normalized Difference Vegetation Index) levels, a measure used to assess vegetation health, density and coverage.
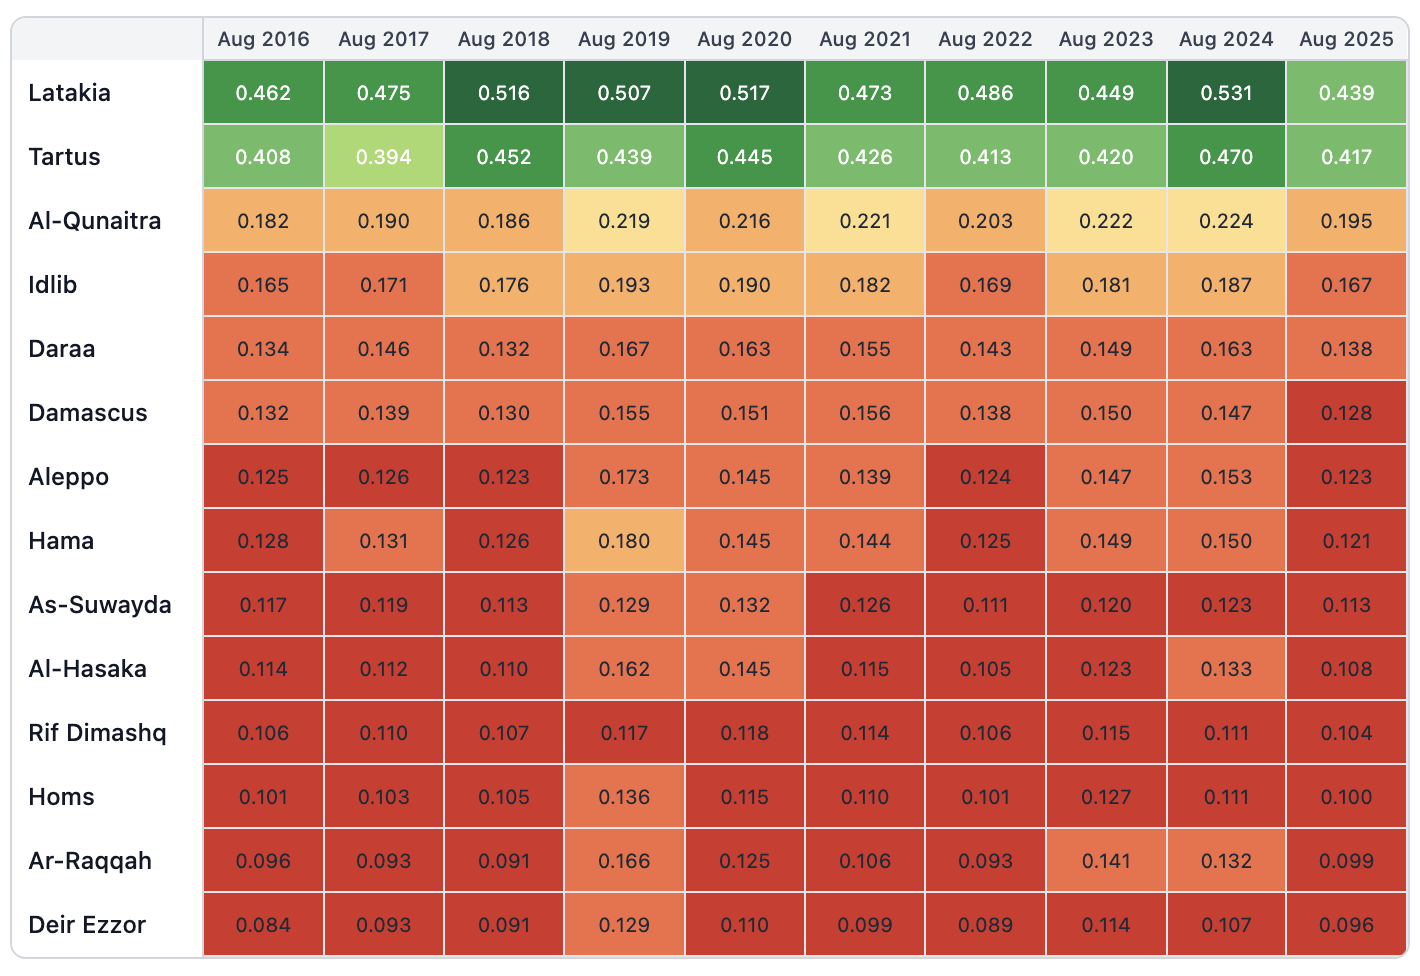
Heatmap of Median NDVI levels per Governorate: August (2016 - 2025)
Key Highlights
Nationwide Decline: All 14 of Syria's governorates recorded a Year-over-Year (YoY) decrease in median NDVI levels, with declines ranging from 6.3% to 25%.
Most Affected Governorates: Ar-Raqqah (-25%), Aleppo (-19.6%), and Hama (-19.3%) recorded the steepest YoY declines in vegetation health.
Least Affected Governorates: Rif Dimashq (-6.3%), As-Suwayda (-8.1%), and Homs (-9.9%) registered the smallest, though still significant, YoY declines.
Request Access
The complete dataset, which includes monthly data from February 2000 through August 2025, is available upon request. You can request access by filling out the inquiry form on our product page.
About This Product
Syria Vegetation Index is a satellite-derived data product by Syria From Above. It tracks monthly vegetation health trends across Syria at the governorate, district, and subdistrict levels—available from 2000 to the present.
Acknowledgment
Syria Vegetation Index uses open-access data provided by the National Aeronautics and Space Administration (NASA) and the OpenStreetMap (OSM) community. It is intended for informational purposes only.
Syria Nighttime Light Index: August 2025
August 2025 data reveals a widespread year-over-year decline in median nighttime light levels
The August 2025 edition of Syria Nighttime Light Index reveals a widespread year-over-year decline in median nighttime light levels, a proxy for economic activity.
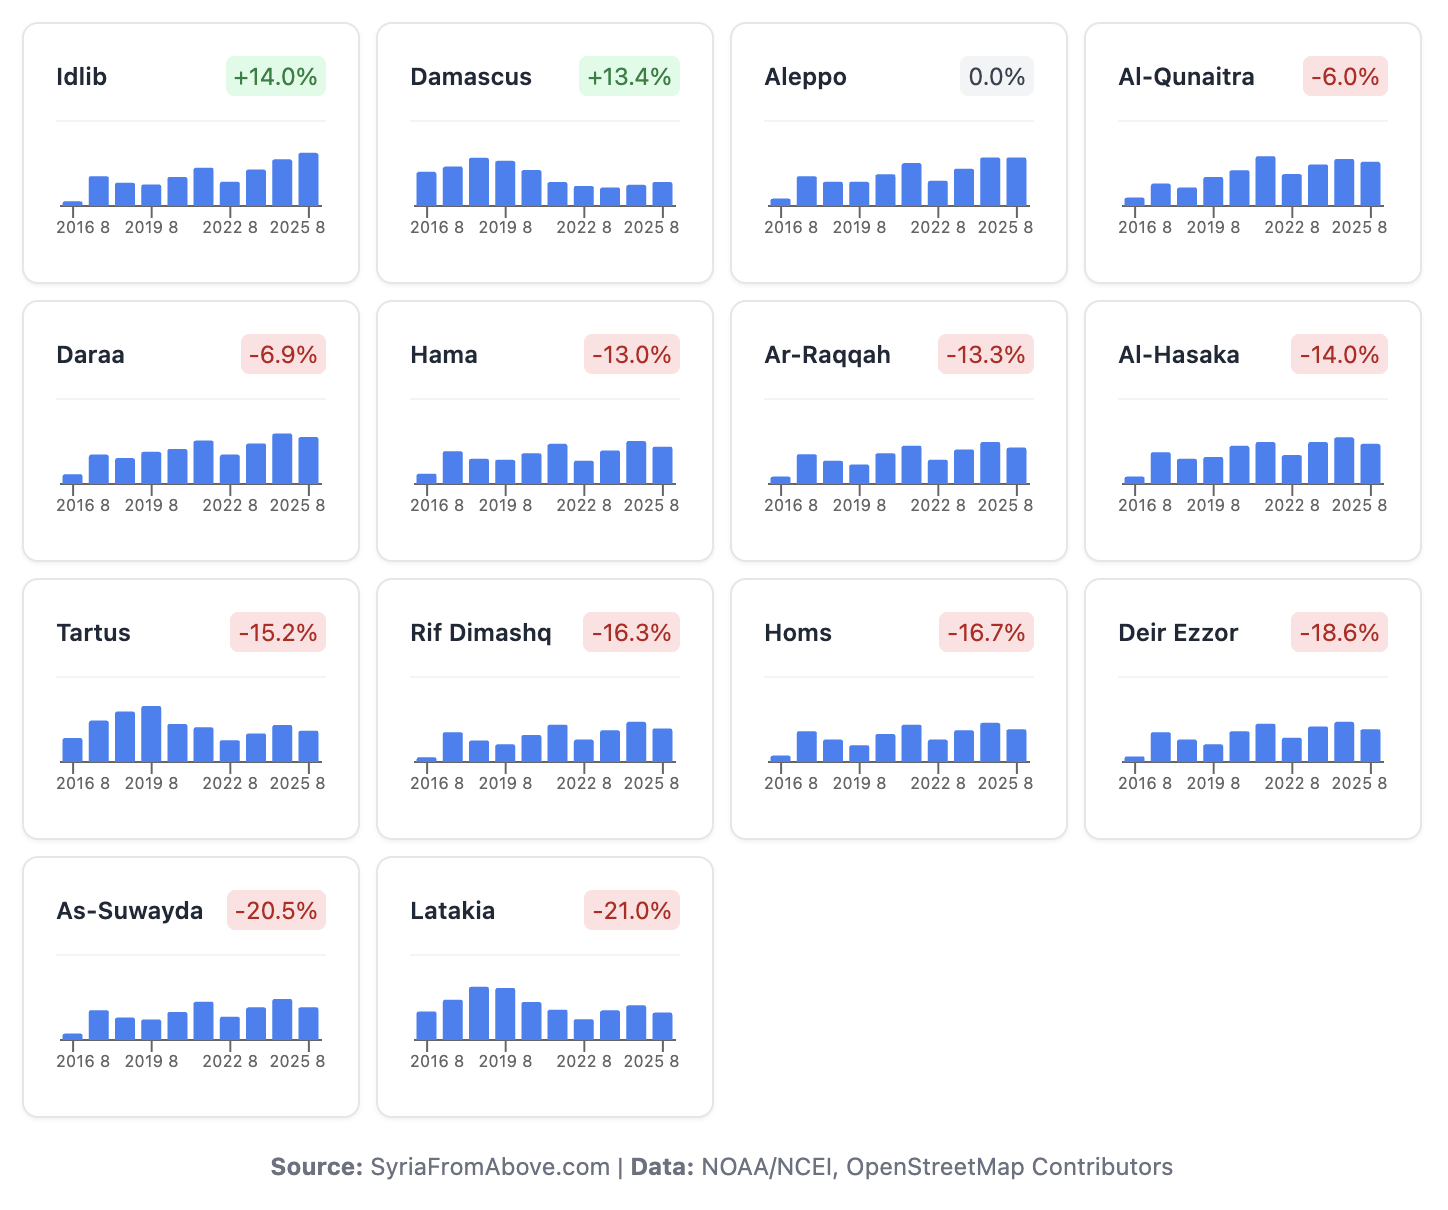
Median Nighttime Light Levels per Governorate: August (2016 - 2025)
Key Highlights
Widespread Declines: 11 of the 14 governorates saw a year-over-year drop in median nighttime light levels in August 2025, with the steepest declines recorded in Latakia (−21.0%) and As-Suwayda (−20.5%). This might suggest a broad economic slowdown.
Pockets of Growth: Idlib (+14.0%) and the capital, Damascus (+13.4%), were the only governorates to record a year-over-year increase in median nighttime light levels in August 2025.
Stagnation in Aleppo: Aleppo, a key economic hub, recorded no year-over-year change in its nighttime light levels in August 2025.
Request Access
The complete dataset, which includes monthly data from April 2012 through August 2025, is available upon request. You can request access by filling out the inquiry form on our product page.
About This Product
Syria Nighttime Light Index is a satellite-derived data product by Syria From Above. It tracks monthly nighttime light trends across Syria at the governorate, district, and subdistrict levels—available from 2012 to the present.
Acknowledgment
Syria Nighttime Light Index uses open-access data provided by the National Oceanic and Atmospheric Administration (NOAA) and the OpenStreetMap (OSM) community. It is intended for informational purposes only.